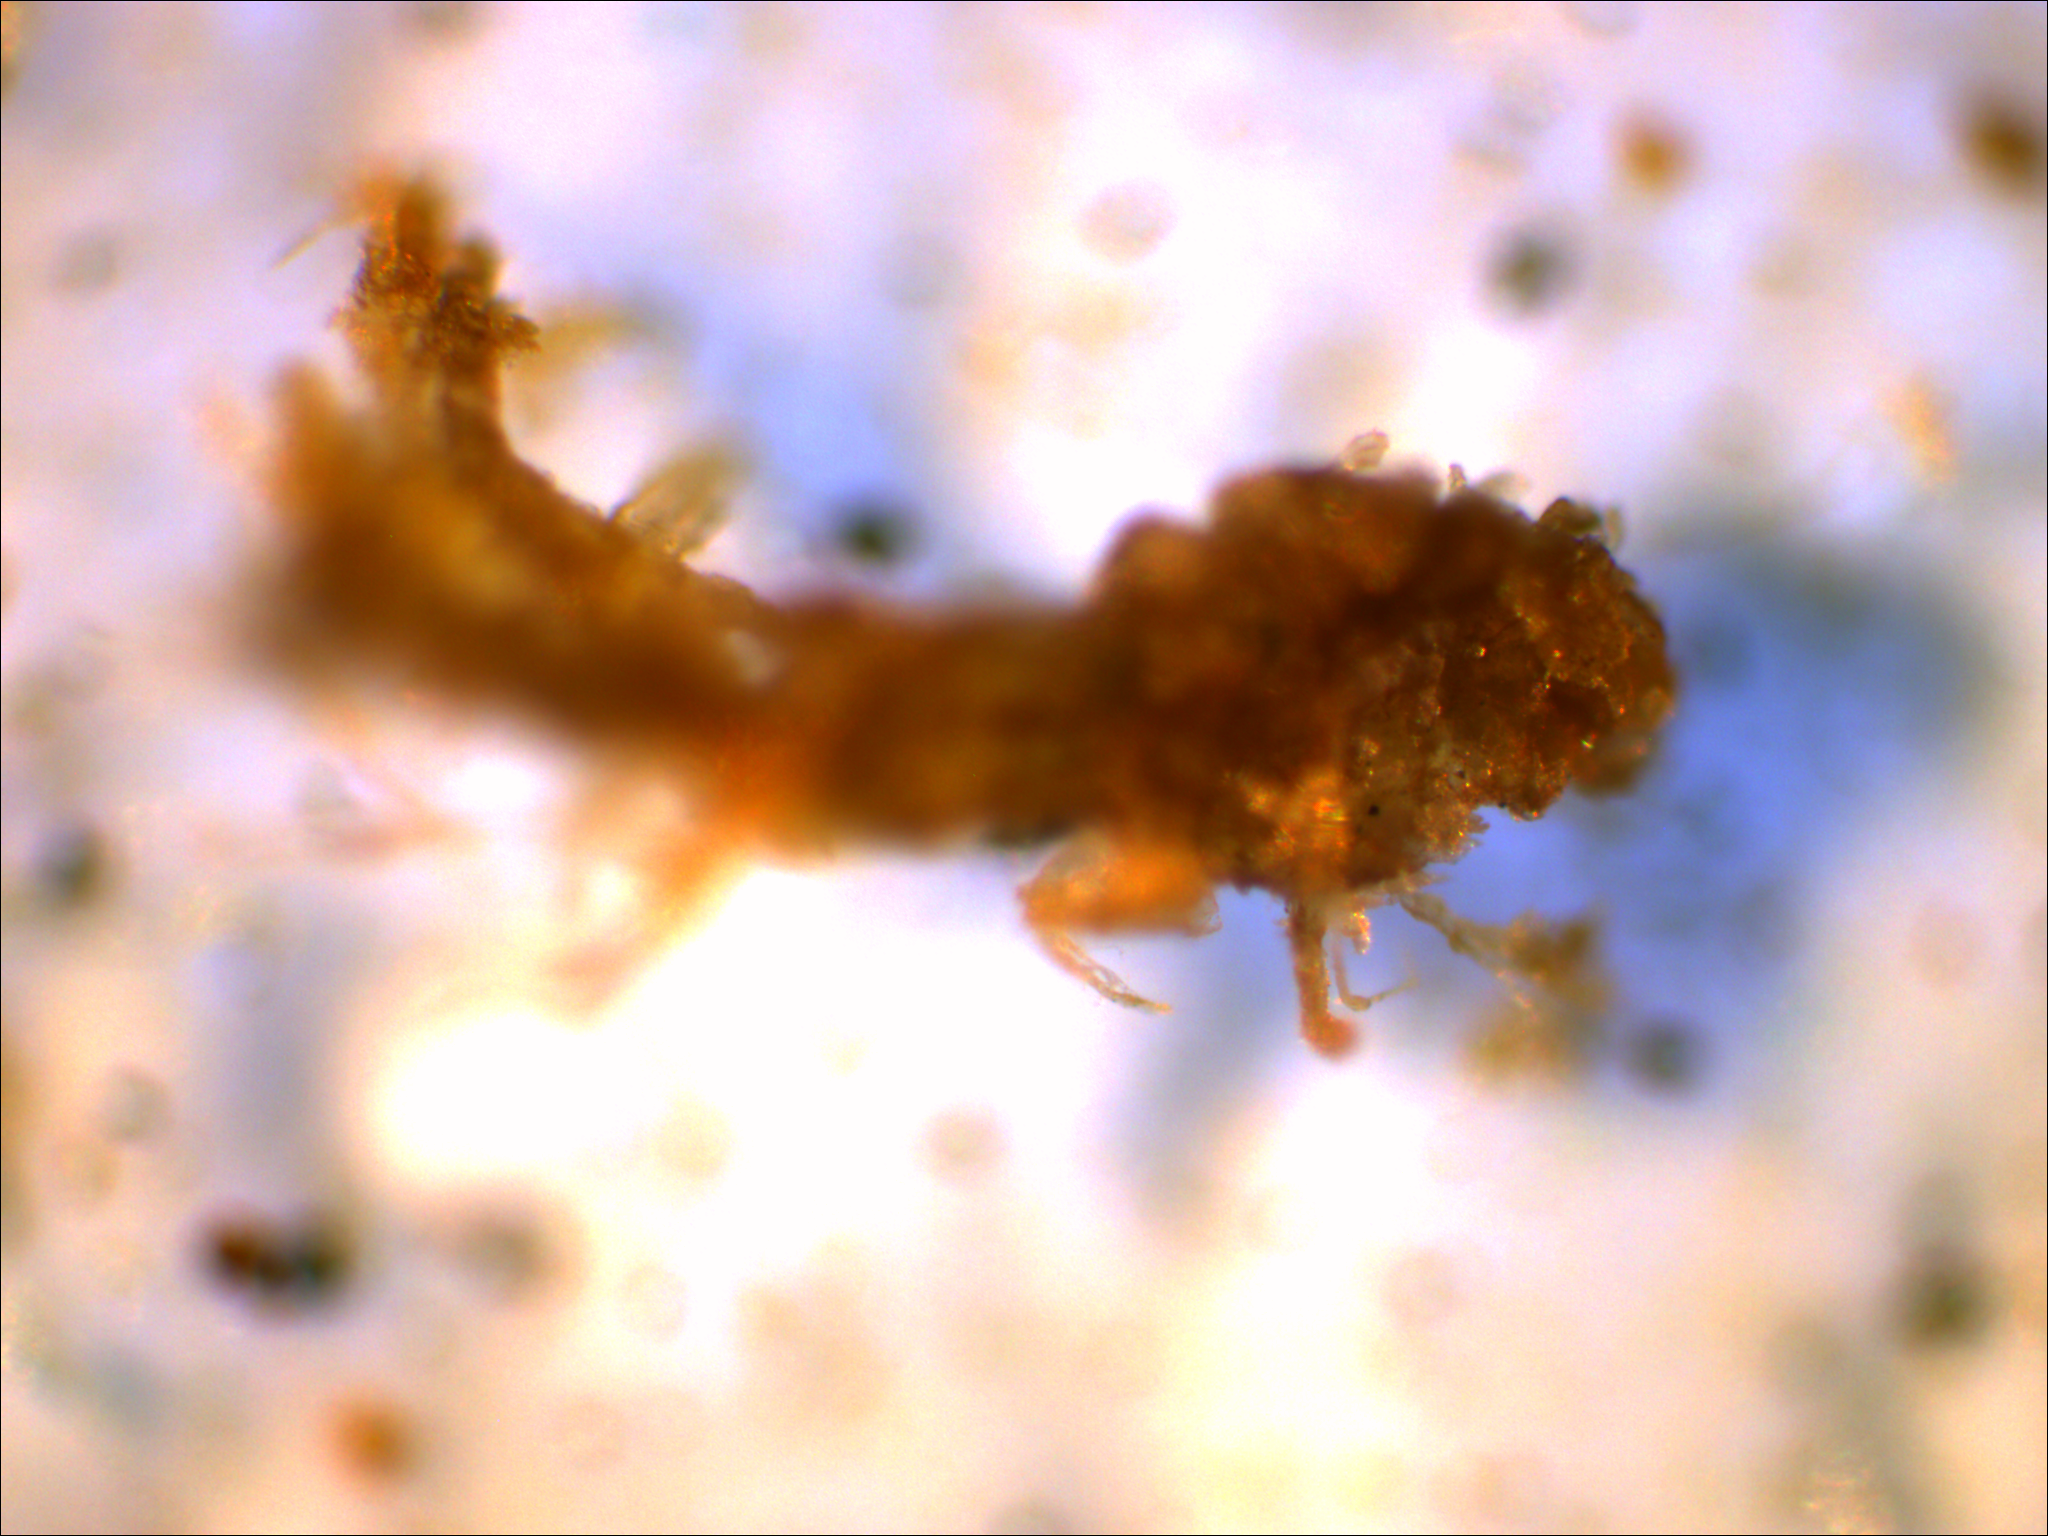
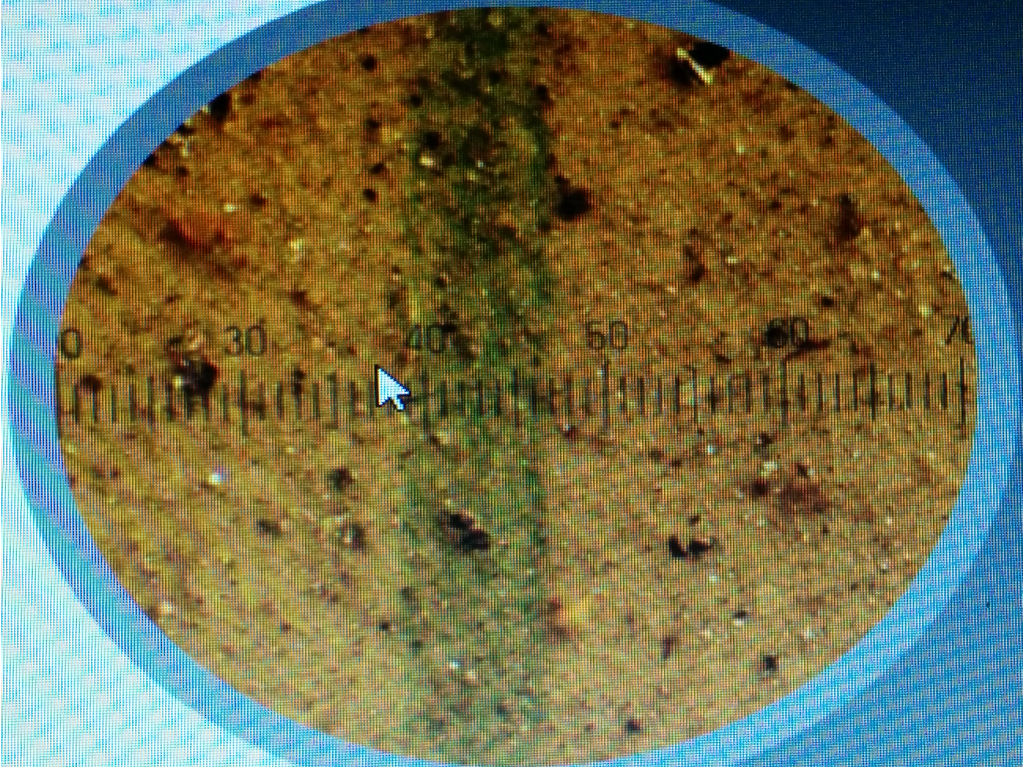
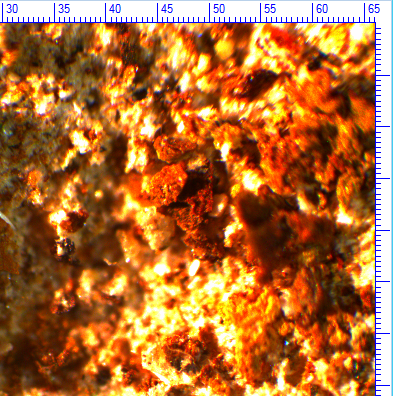
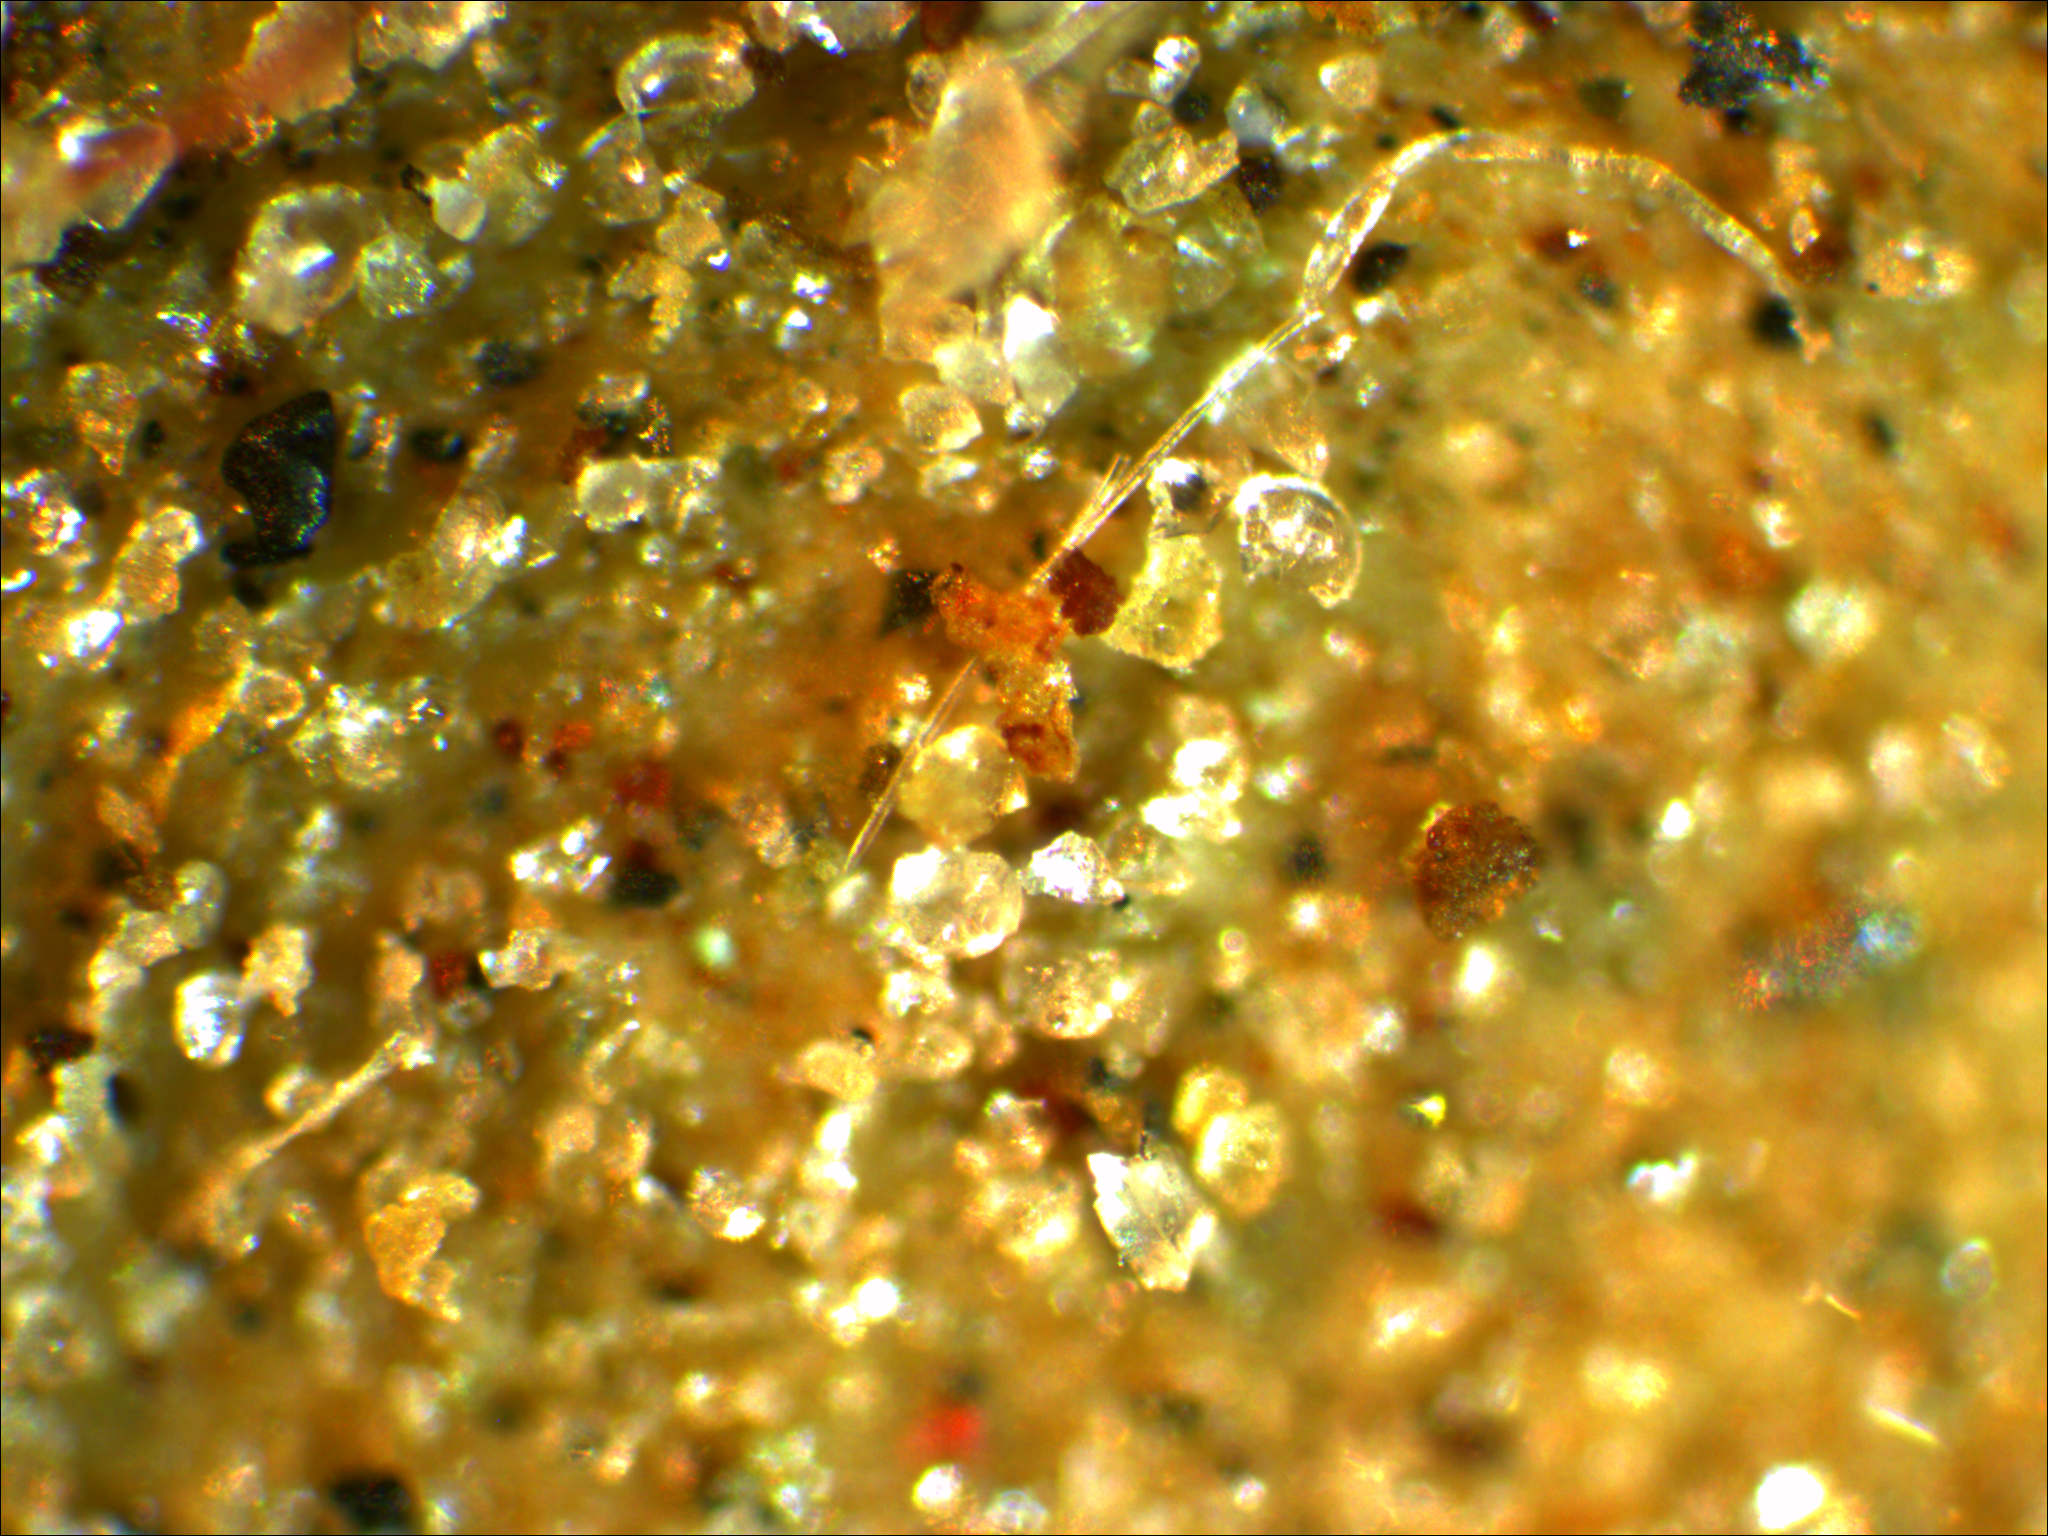
After we’ve compiled the raw data of the particulate distribution analysis in your diesel fuel, we take a sample of fuel and run it through a special filter to capture all of the particulate down to one micron. We then put the filter under the microscope and magnify it up to 200 times. This way we put context to the particulate distribution numbers to view the composition of particulate. This allows us to differentiate between silica and bright metals, black metals and rust particles, fibre and precipitates (emulsified water, fuel additives leaving suspension and signs of ageing).
We’ve found this live image capture of information to really enhance the data values with differentiation of issues. This key differentiation helps us diagnose where to target the polishing process if required, and whether our fuel additive needs to be added or not.
Over time, the trends in fuel quality allow you to take action early or defer action when substantiated with science. This objective perspective is traceable and is stored for backup for 7 years in case you lose your copy.
Here are just a few examples of what we’ve seen that the naked eye would otherwise be blind to: